
// primary subscription
On-Demand Marketing
A modular marketing department for professional service businesses. The client sets their pace with active production slots and chooses their ad distribution channels.
Clear priorities. Controlled capacity. Consistent execution.
7-Day Working Trial · 30-Day Shipped Guarantee
Submit as many priorities as you need. Your active production slots determine how many initiatives move forward at once.
Start with $0 due today. Get your 30-day board mapped and first deliverable shipped in 7 days — cancel before Day 8 if it's not a fit.
Get your 30-day board mapped and your first deliverable shipped in 7 days. Cancel anytime before Day 8.
// money model
Configure one subscription
Base + capacity + channels + leadership are components of the same service — not competing products.
Base
$2,000/month
Core infrastructure, specialist access, monthly strategy review, and the first active production slot. Covers video/photo editing, scripting, storyboarding, ad creative, email/SMS, landing page updates, local visibility, automations, and copy. Tracking included.
Add capacity
$1,600 per active slot
Enables parallel execution. Each slot allows one additional initiative in active production simultaneously.
Add channels
$500 per ad channel
Strategy, audience targeting, ad setup, and ongoing optimization. Covers up to $10k/mo spend per channel. Supported: Meta, Google, TikTok, CTV/OTT, Microsoft/Bing, LinkedIn, Snapchat, Pinterest, X, Reddit, Amazon, Spotify.
Add leadership
$1,600 Executive CMO add-on
Upgrades the monthly meeting to weekly executive strategy calls. Dedicated executive for leadership meetings, cross-department coordination, growth strategy, and team direction.
Example configuration
$5,950/month
Base ($2,000) + 1 Extra Active Slot ($1,600) + Google Ads ($500) + CMO Add-On ($1,600) = $5,700 / month
Ad spend — read this
Management covers up to $10,000/month in ad spend. Ad spend is paid separately by the client. Accounts spending over $10k/mo are custom quoted.
Supported ad channels
Get your 30-day board mapped and your first deliverable shipped in 7 days. Cancel anytime before Day 8.
// proof
Relevant outcomes
Medical spa
21% More Patient Feedback Without Increasing Ad Spend
January 1 to September 21, year over year
436 → 528 feedback responses
- What was broken?
- DermaCare TriCities already delivered a strong patient experience, but its feedback process was inconsistent.
- What did Cosmic do?
- Improved the internal review system so more patients were prompted to share their experience at the right time.
- What changed?
- Internal feedback increased from 436 to 528 responses (21.1%). The profile held 121 Google reviews at a 4.9 average rating with 80% positive sentiment.
- Correlation vs causation
- Defensible claim is feedback-system improvement and reputation strength—not a claim that Google reviews grew 100%.
Medical spa
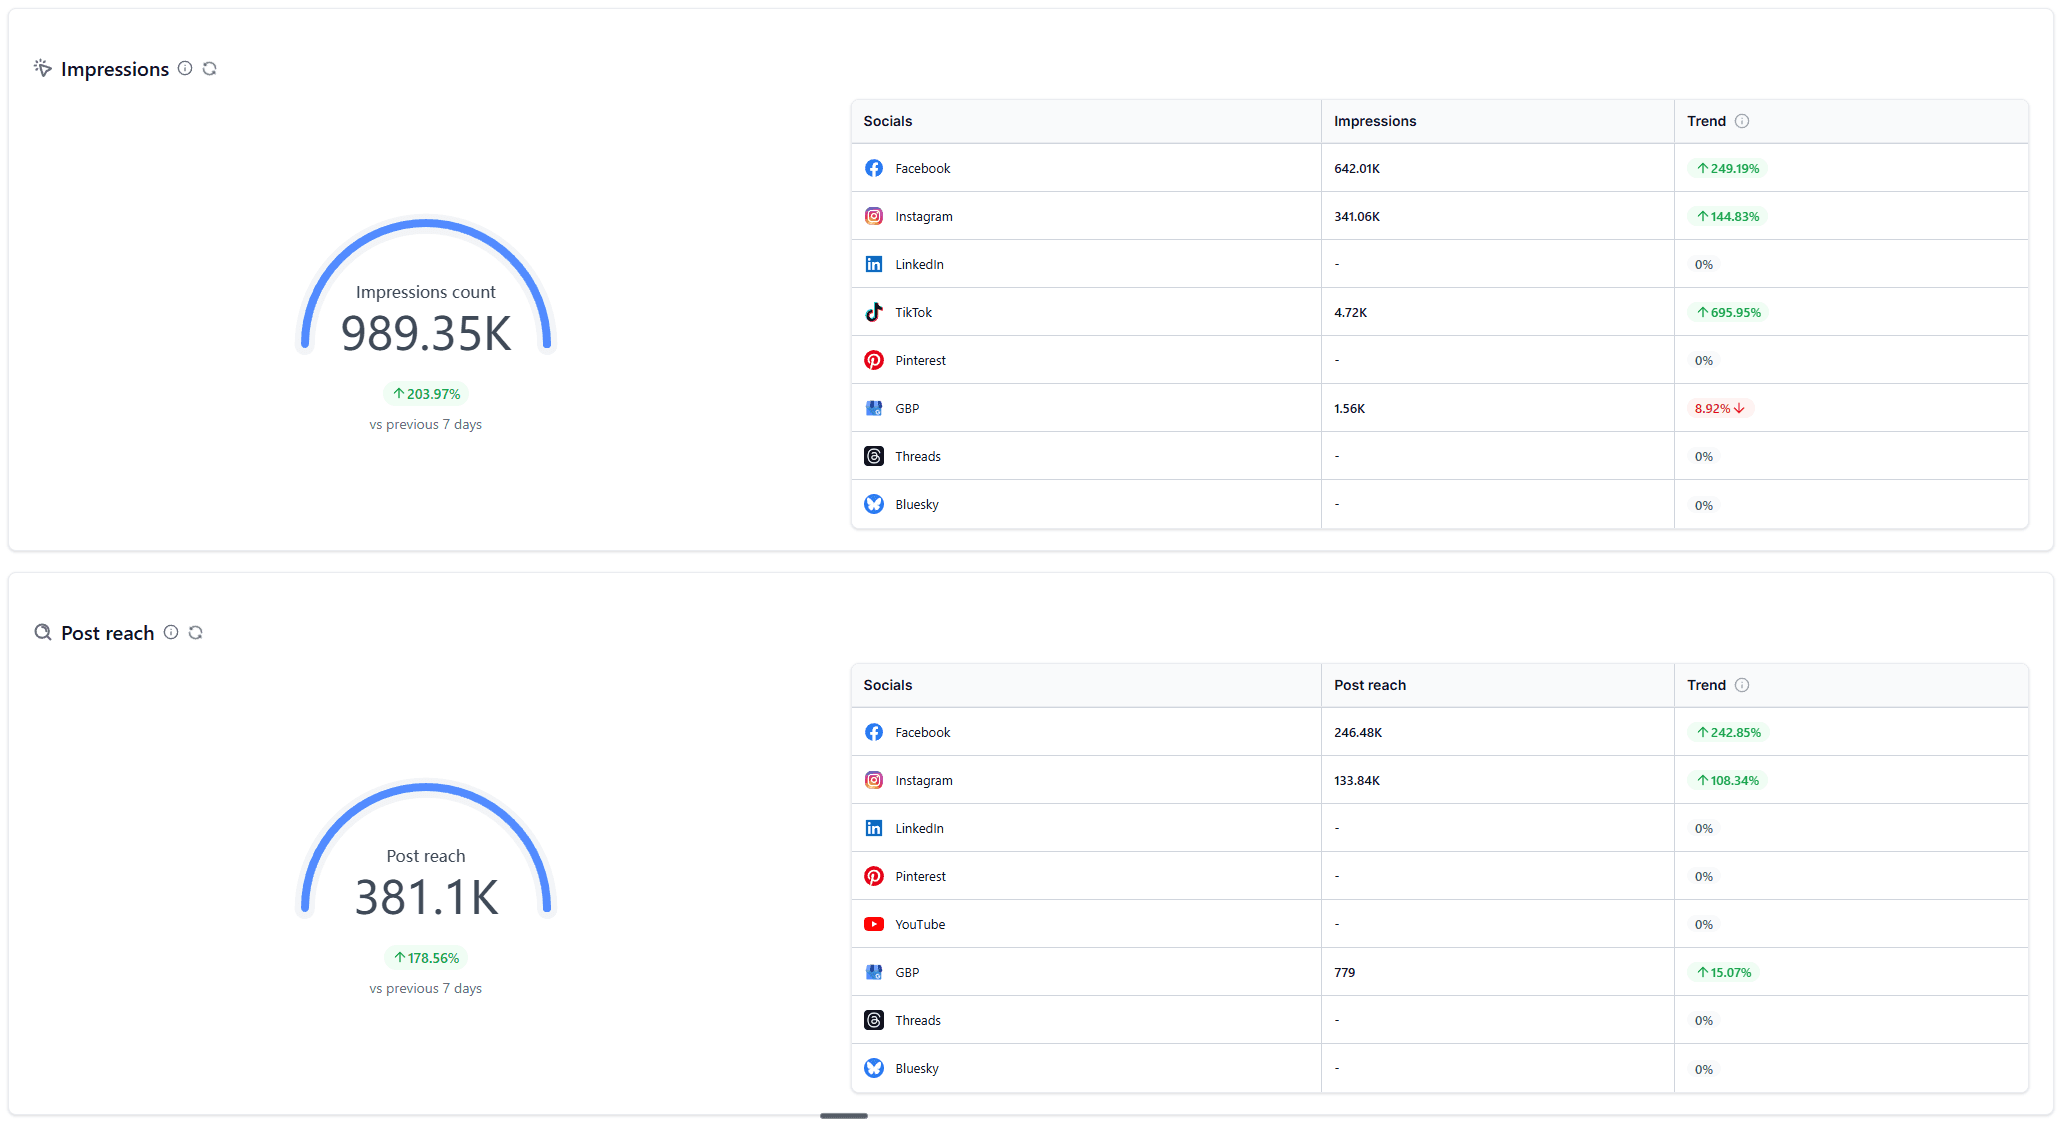
44% Revenue Growth Supported by 204% More Social Impressions
March 2026 vs March 2025
- What was broken?
- The medical spa wanted more demand without relying on a single marketing channel.
- What did Cosmic do?
- Consistent social execution and content distribution across Facebook, Instagram, TikTok, and Google Business Profile to increase local awareness and engagement opportunities.
- What changed?
- Revenue +44.06% to $342,280; visits +34.28%; average ticket +7.29%; revenue per hour +11.09%. Social impressions +203.97% to 989,350; post reach +178.56%.
- Correlation vs causation
- Shows strong correlation between marketing growth and business growth. Does not claim social media alone caused every dollar of revenue increase.
Local coffee shop
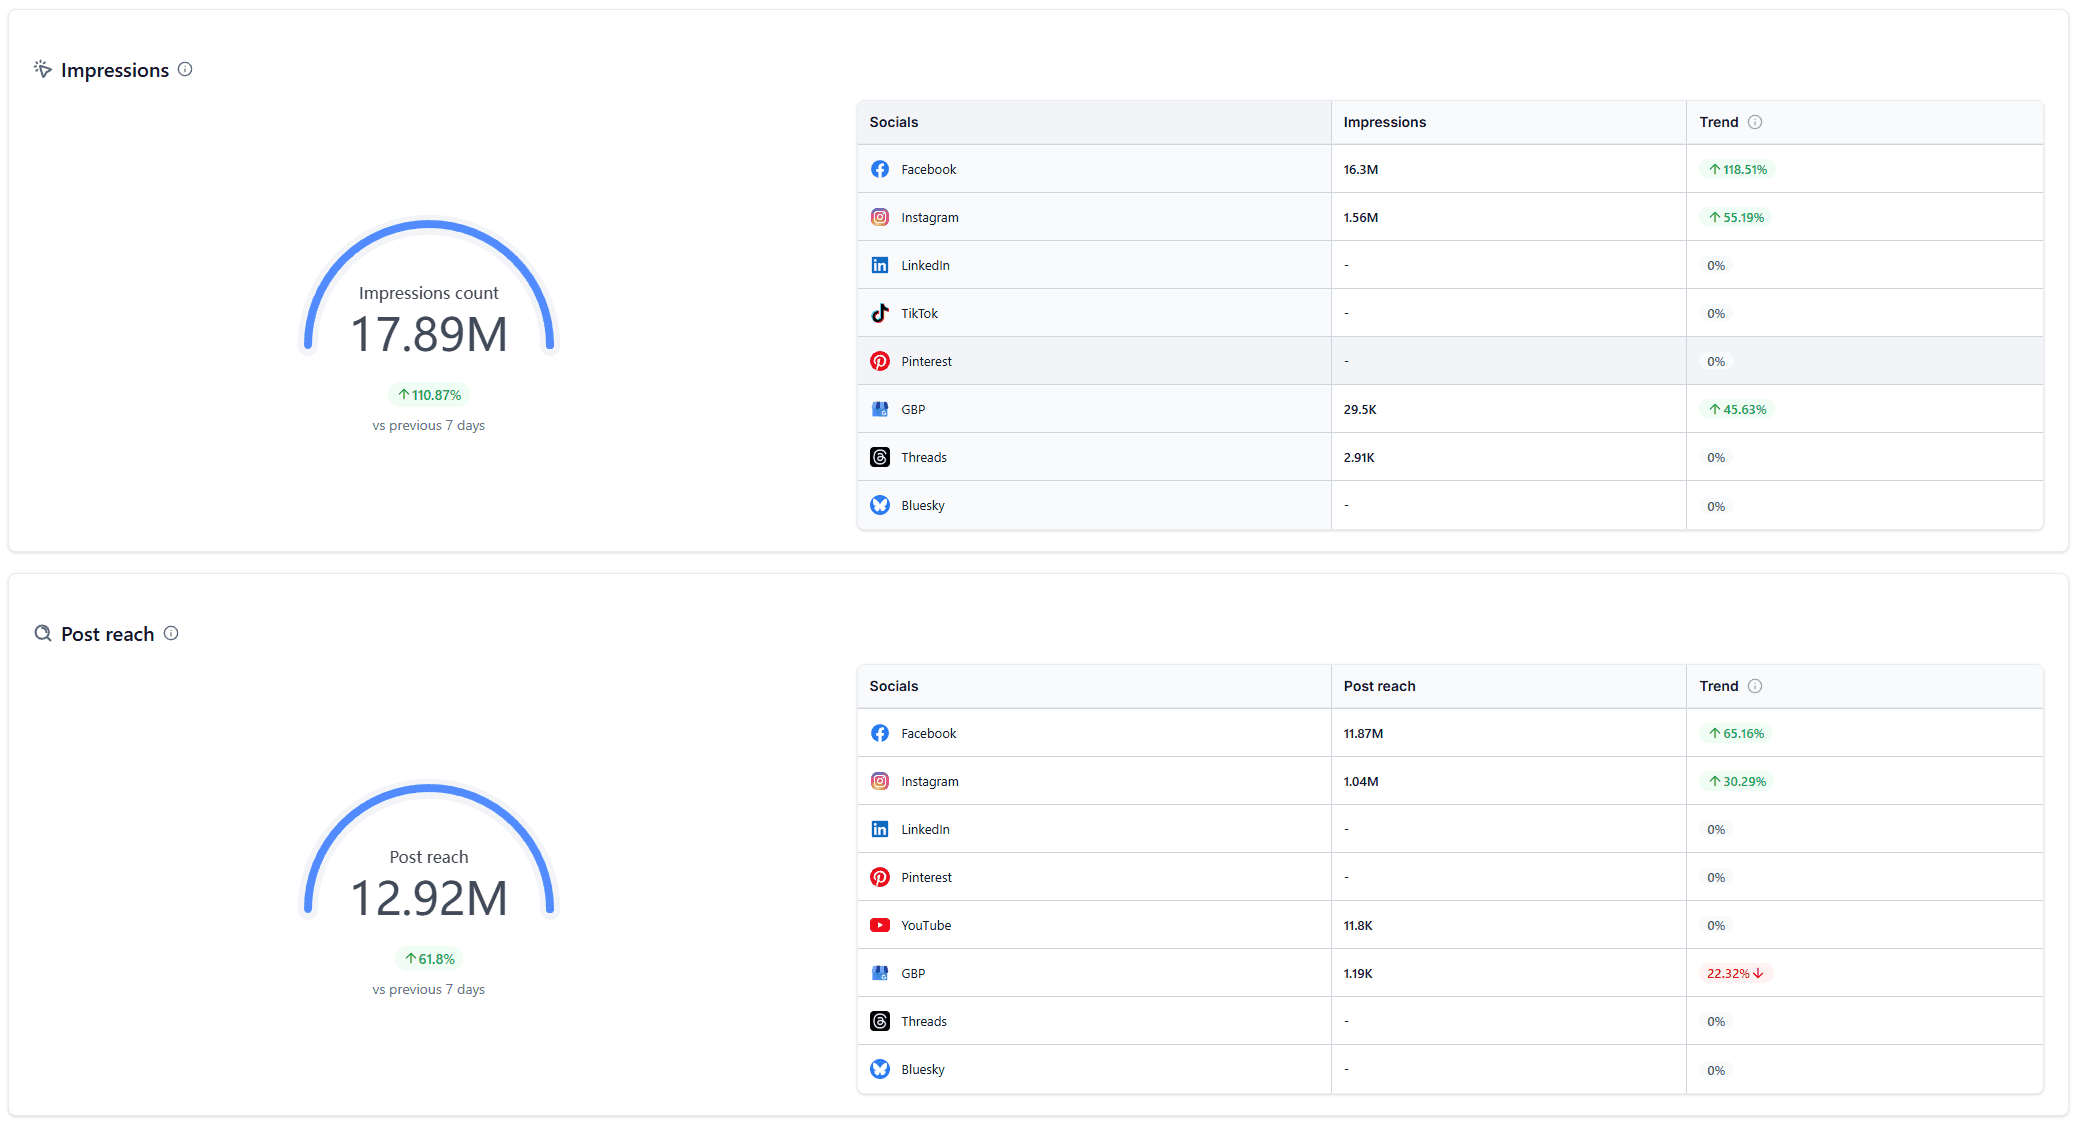
We Increased a Local Coffee Shop’s Visibility by 111% Year Over Year
Year-over-year comparison (same period last year)
- What was broken?
- The coffee shop needed more consistent local discovery across social and Google Business Profile.
- What did Cosmic do?
- Consistent social media management and local visibility optimization across Facebook, Instagram, and Google Business Profile.
- What changed?
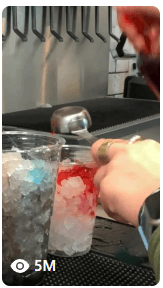
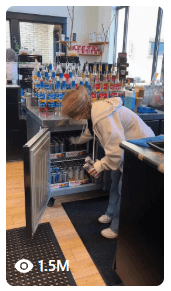
- 17.89M total impressions (+110.87%), 12.92M post reach (+61.8%), Google Business Profile impressions +45.63%. Individual short-form clips hit 5M, 1.5M, and 935K views.
- Correlation vs causation
- Defensible claim is substantially increased visibility and local discovery—not that every view became a customer or that social alone caused all revenue.
Get your 30-day board mapped and your first deliverable shipped in 7 days. Cancel anytime before Day 8.